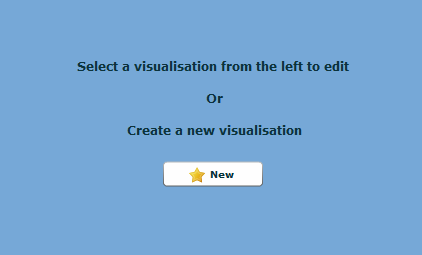
In the Data
Visualiser window, click ![]() in the left pane.
in the left pane.
OR
Click ![]() in the
in the
The Create Visualisation dialog opens.
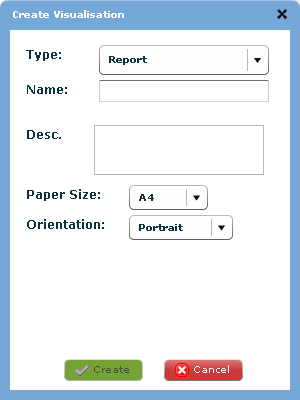
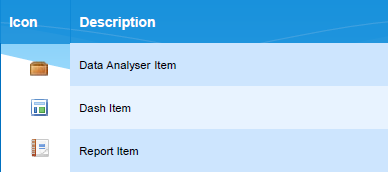
Select the type of visualisation.
Report - Select to create a standard report for exporting.
Dash Item - Select to create a dash item for the Dashboard.
Data Analyser - Select to create a visualisation item for the
Data Analyser.
Type a name for the new visualisation.
Tip: It is helpful to use a name that is easily recognizable.
The name should be descriptive of the collection of visualisations
that will be placed.
Type a description of the visualisation.
Select the appropriate Paper
size from the drop-down list for a report.
Note: This option is only available
for the report option.
Select the appropriate Orientation from the drop-down list for a report.
Click  to add
the report, dash item or data analyser item to the appropriate list.
to add
the report, dash item or data analyser item to the appropriate list.
Repeat steps 2 - 8 until all the necessary visualisations are added.
After the Create
Visualisation dialog closes, click  to save
the visualisation.
to save
the visualisation.