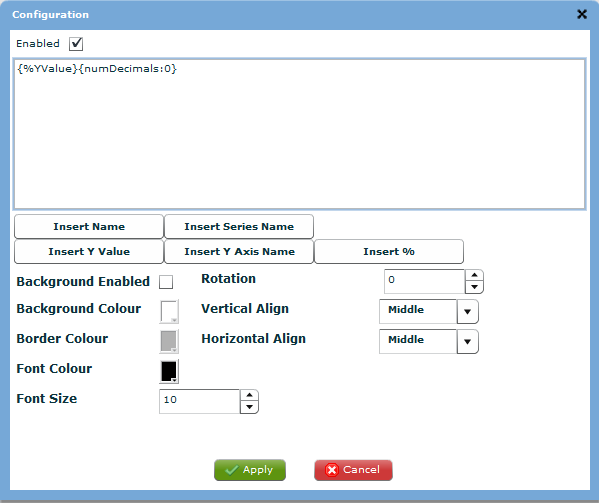
Configure the tooltips in the charts to explain the information being displayed. For all chart types bar the line chart the tooltip settings are enabled by default.
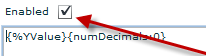
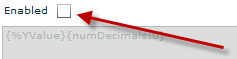
To change the enabled status of the tooltips, change the checked status of the Enabled checkbox.
If the check box is checked then the tooltips are enabled.
If the check box is unchecked then the tooltips are disabled.
The main text area in this configuration is for designing the tooltips that are shown on the data points.

Below the text area are some pre-configured buttons that allow some basic label designs to be input.
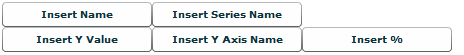
Insert Name will insert the X value of the data point into the label.
Insert Series name will insert the data point series name into the label.
Insert Y Value will insert the Y value of the data point into the label.
Insert Y Axis Name will insert the label of the Y axis into the data point label.
Insert % will insert the percentage that this data points Y represents against the sum of all Y values.