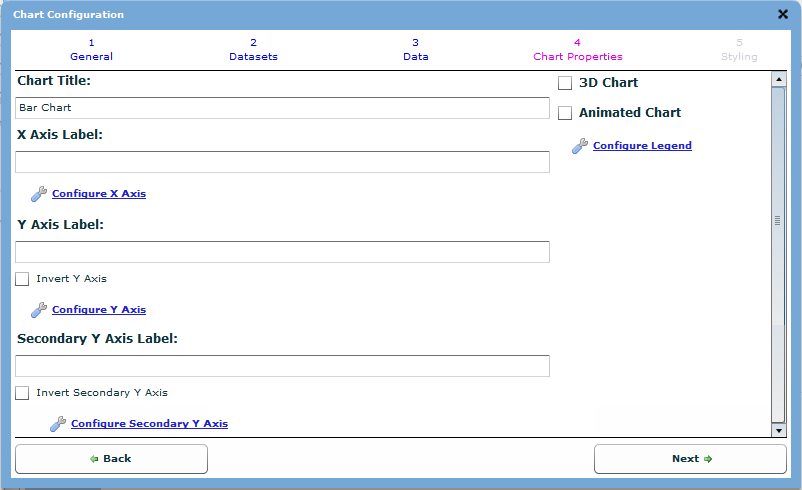
The Chart Configuration Tab allows for the customisation of the non-data specific sections of the chart.
Chart Title
Edit the Chart Title text to change the header of the chart. This is typically a short description of the function of the chart, such as Depth Vs. Days.
X Axis Label
Edit the X Axis Label text to change the text for the X Axis field.
Tip: This field is hidden in the pie chart.
By default, VisNet suffixes the name with any unit that is applied to the value that is displayed in the X Axis.
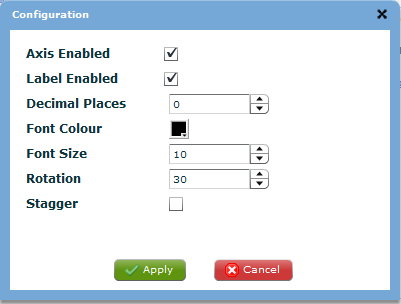
X Axis Configuration
Click to configure how the X Axis appears in the chart. The Configuration dialog opens.
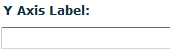
Y Axis Label
Edit the Y Axis Label text to change the text for the Y Axis field.
Tip: This field is hidden in the pie chart.
By default, VisNet suffixes the name with any unit that is applied to the value that is displayed in the Y Axis.
Invert Y Axis
Enable to control whether the Y Axis on the chart is inverted. Disable for the Y Axis to begin with the lowest value at the bottom of the axis and increase upwards.
Non-Inverted

Inverted

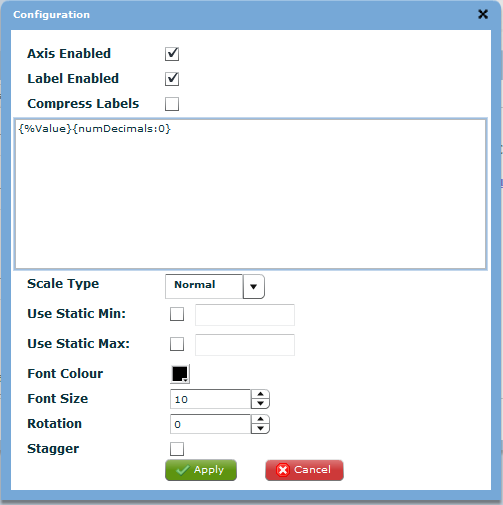
Y Axis Configuration
Click to configure how the Y Axis appears in the chart. The Configuration dialog opens.
Secondary Y Axis Label
Edit the secondary Y Axis Label text to change the text for the secondary
Y Axis field.
Tip: This field is hidden in the pie chart.
By default, VisNet suffixes the name with any unit that is applied to the value that is displayed in the secondary Y Axis.
Secondary Invert Y Axis
Enable to control whether the secondary Y Axis on the chart is inverted. Disable for the secondary Y Axis to begin with the lowest value at the bottom of the axis and increase upwards.

Non-Inverted
Inverted
Secondary Y Axis Configuration
Click to configure how the secondary Y Axis appears in the chart. The Configuration dialog opens.
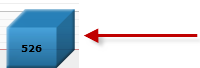
3D Chart
Enable the 3D chart if the chart is rendered as a 3D Chart. Disabled the chart is rendered as a 2D Chart.

2D Chart
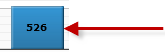
3D Chart
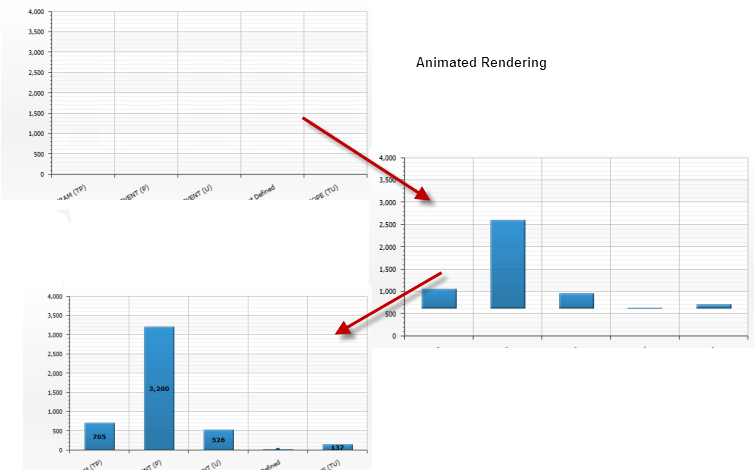
Animated Chart

Enable the whether the chart create is rendered as animated or not. Disable to render the chart without animation.
Non-Animated Chart
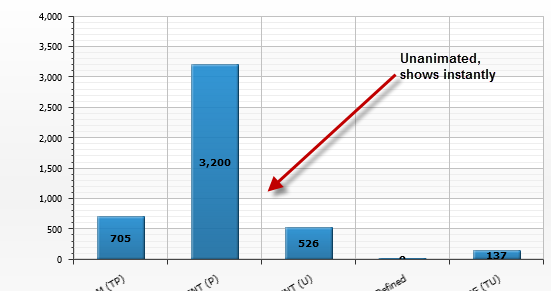
Animated Chart