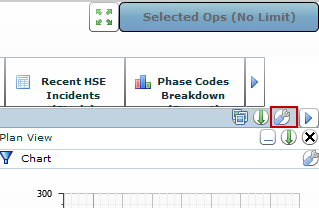
In the selected dashboard, click
 .
.
Tip: This is located at the upper right corner
of the dashboard.
The Dashboard Configuration dialog opens.
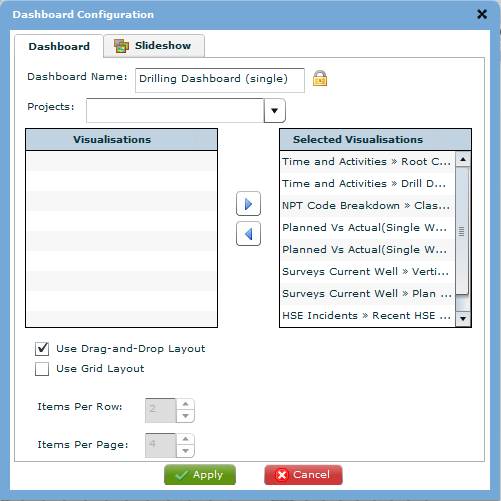
Enable the Use Drag-and-Drop Layout option.
Click  .
.
The Dashboard Configuration dialog closes
and the current dashboard layout is cleared and a blank dashboard.
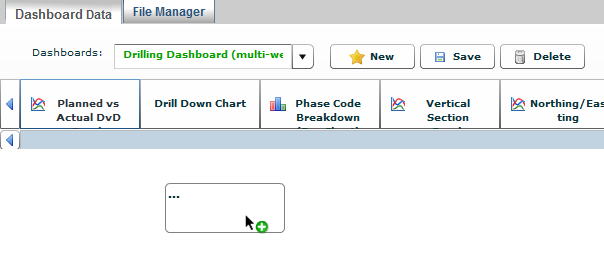
In the blank dashboard canvas,
select the appropriate visualisation from the visualisation ribbon
and drag it to the canvas.
The visualisation loads with the default width and height.
Repeat step 4 until all the visualisations are added to the dashboard.
Arrange the visualisations by
clicking on the header dragging the visualisation to the appropriate
location on the dashboard.
Tip: This is how the heading appears when
selected for moving.
Note: Visualisations cannot be dragged off
the screen. If dragged to a location that is partly off-screen, the
visualisation resizes to fit in the available space.
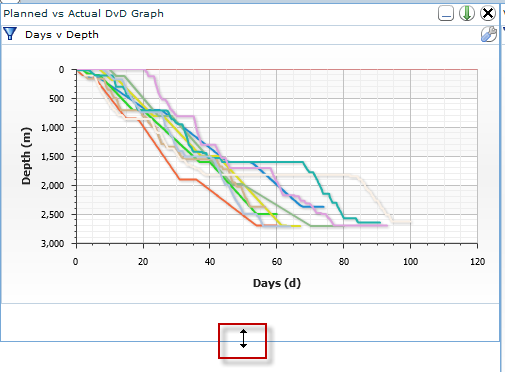
Resize the visualisations by selecting
visualisation and hovering the mouse on the edge until it changes
to a double-arrow. Click and drag the visualisation to the necessary
size.